FRTPLOT
Free Real-time Data Plotter
Frtplot is a program for plotting your numeric data
(such as output from simulations, or sensors) in real time.
A major goal is to eventually provide features for interactive,
real time exploration of data.
The user can zoom into and scroll around the static or real time
updated datasets. Multiple plots with different plotted column
sets can be zoomed together or individually; columns can be hidden
or shown, color and dashing settings changed, column labels enabled
or disabled, etc.
Using it is as simple as printing your data into a white-space
separated text stream, and piping this to frtplot,
supplied with a suitable configuration file.
The versatile configuration format allows for:
- multiple data columns in a record
- calculated columns
- expression language with user defined functions
- multiple plots, showing specific subsets of your data
- strongly configurable plot layout (colors, labeling, dashing, scale settings, etc).
- key bindings to execute configuration statements
- and much more :)
frtplot is written in C. The only dependency is SDL.
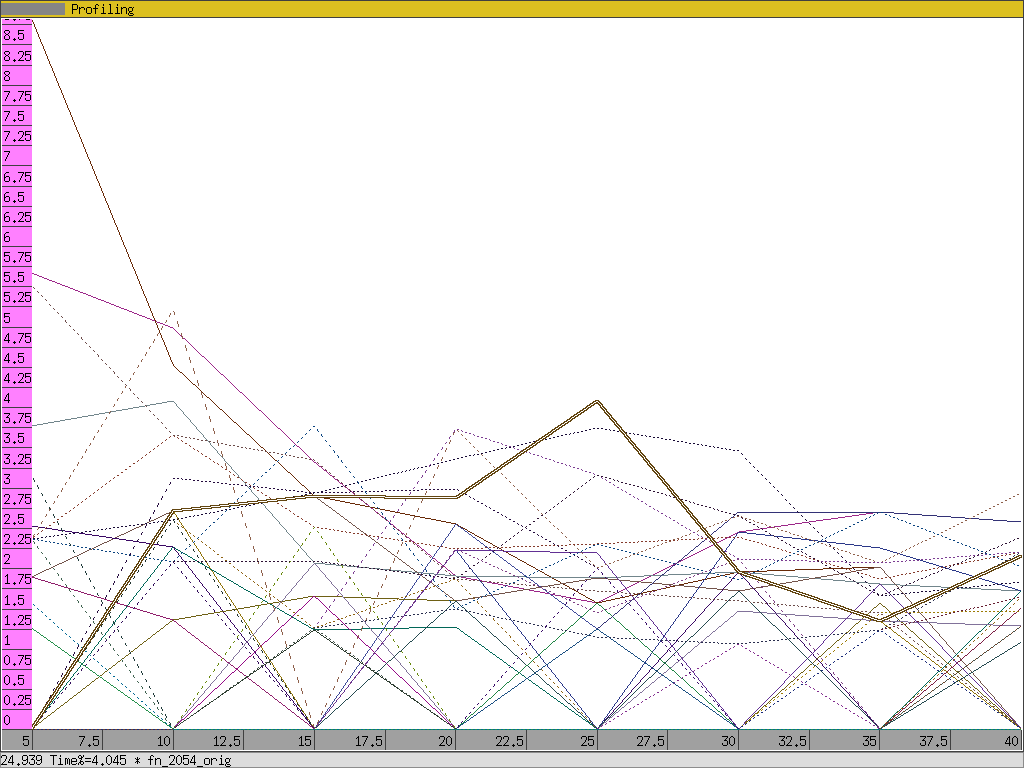
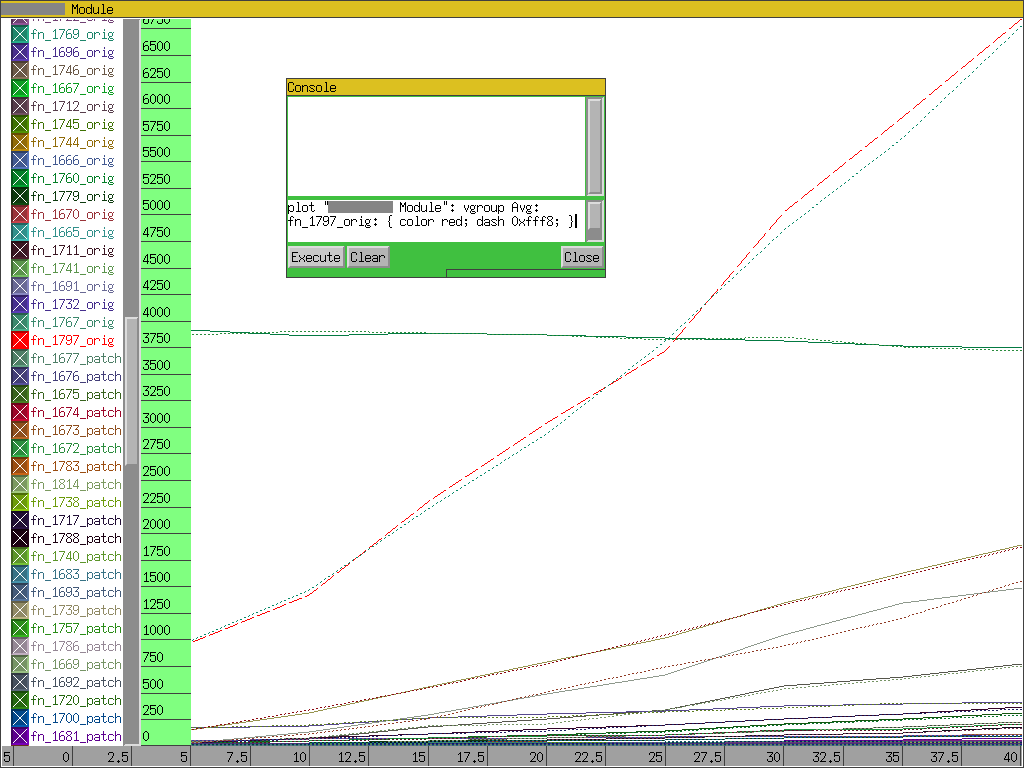
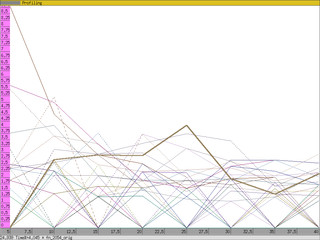
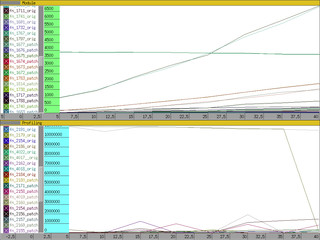
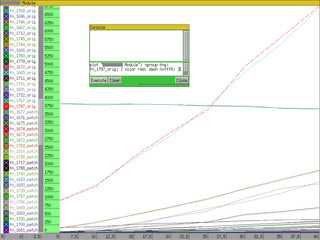
Screenshots
- Analyzing profiling measurement results with
frtplot.
This way, we could compare the measurements made of the original
and a different, patched version of the real-time simulation software.
(Labeling had to be anonymized for the screenshots.)
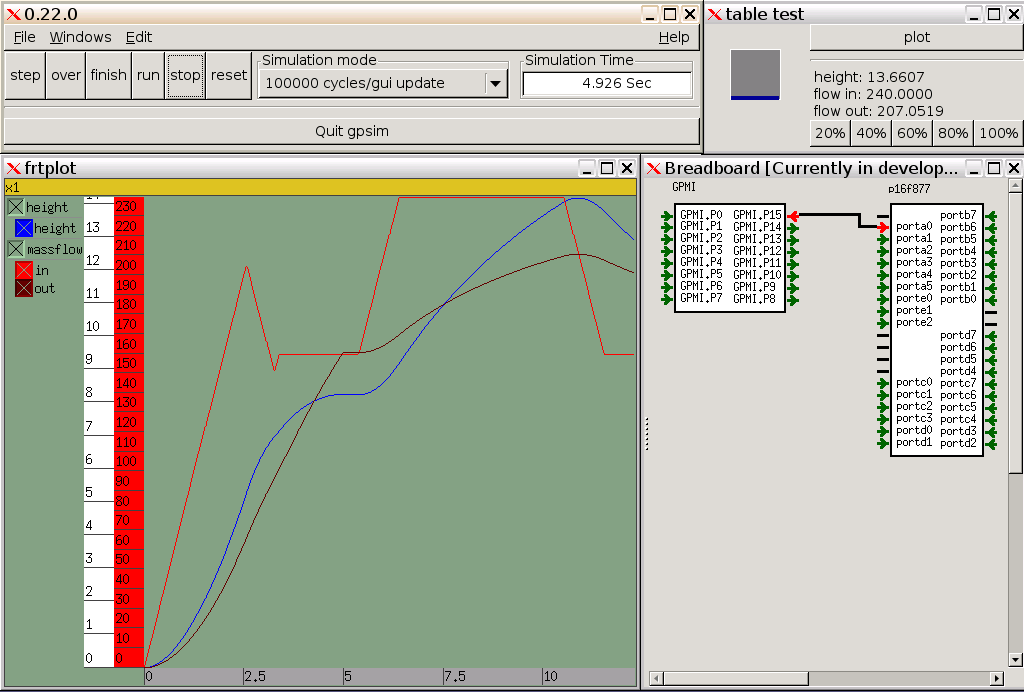
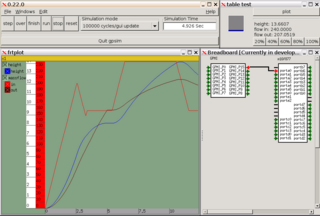
Frtplot together with gpsim, showing an ongoing microcontroller simulation.
frtplot is under development; there are no stable
releases yet. You can try the current version by checking it
out from the Subversion repository:
svn co svn://repo.hu/frtplot
This is open source software, under the GPL version 3
license.
Contact:
- IRCNet #awk
- mnagy AT port70.net